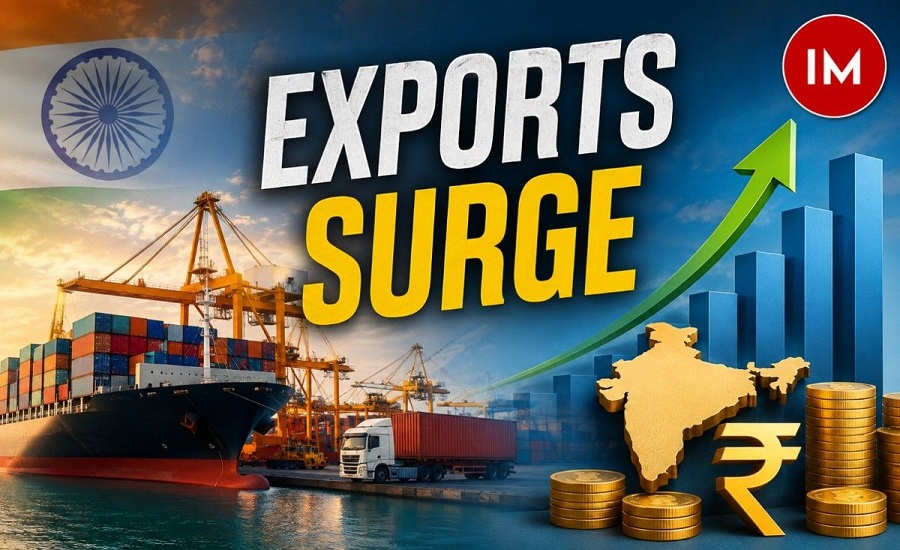
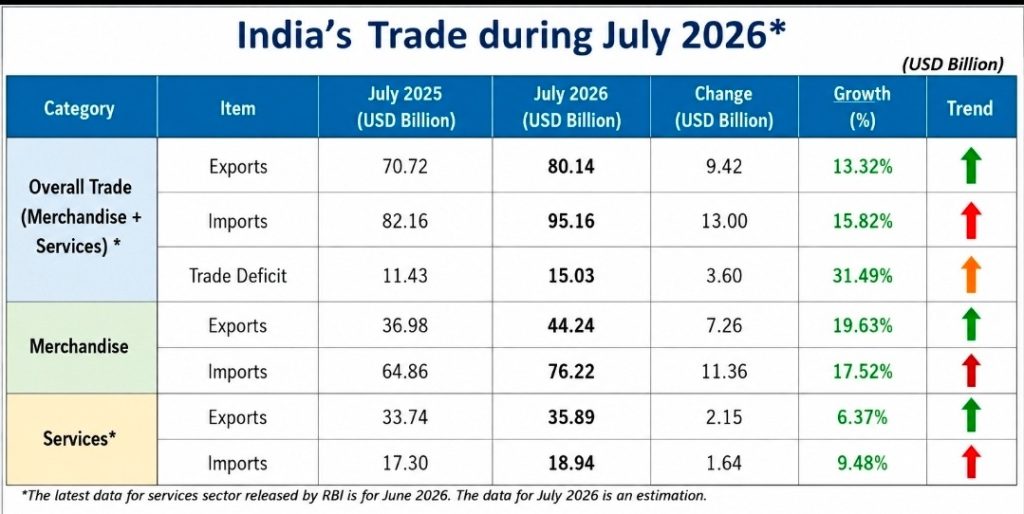
New Delhi: India’s merchandise exports registered a strong 19.63% year-on-year growth to $44.24 billion in July 2026, reflecting robust momentum across key export sectors including petroleum products, electronic goods, engineering goods, chemicals and textiles.
However, the sharp increase in exports was accompanied by an even larger rise in imports. Merchandise imports climbed 17.52% to $76.22 billion in July, compared with $64.86 billion in July 2025.
As a result, India’s merchandise trade deficit widened to $31.98 billion, compared with $27.88 billion in the corresponding month last year.
The latest figures indicate that while India’s export engine continues to gain strength, the faster growth in imports remains a challenge for the country’s merchandise trade balance.
Commerce Secretary Rajesh Agrawal, a 1994 batch Indian Administrative Service (IAS) officer from Manipur cadre, said exports to West Asian countries increased 8.62 per cent to $5.7 billion in July. He attributed the overall rise in exports to higher shipments of petroleum products, electronics, engineering goods and marine products.
Total Exports Rise 13.16% During April-July
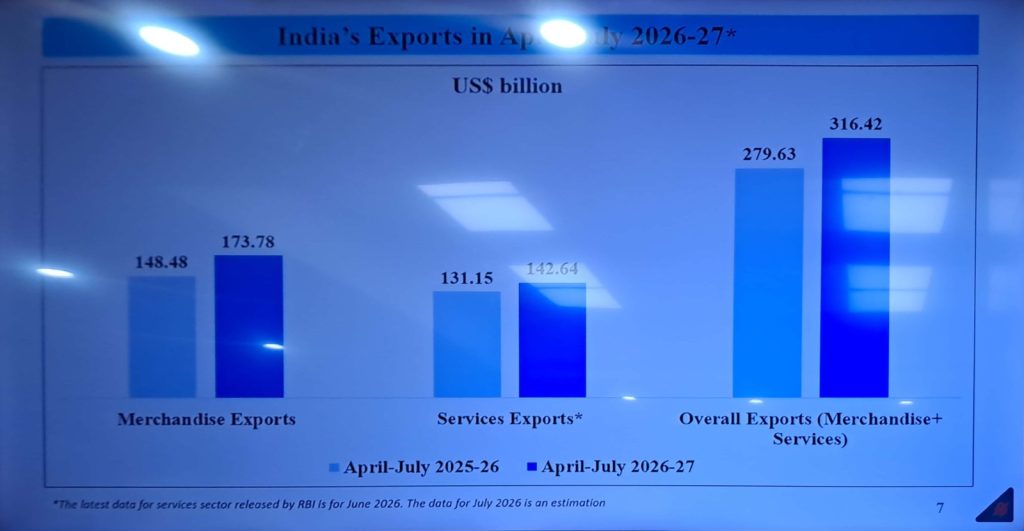
India’s cumulative exports, including merchandise and services, during April-July 2026-27 are estimated at $316.42 billion, registering a 13.16 per cent increase over $279.63 billion in the year-ago period.
Total imports during the four-month period rose 17.28 per cent to $365.85 billion, compared with $311.94 billion a year earlier. Consequently, the overall trade deficit widened to $49.43 billion, from $32.32 billion during April-July 2025-26.
Merchandise exports during April-July climbed 17.04 per cent to $173.78 billion, compared with $148.48 billion in the corresponding period last fiscal. Merchandise imports, however, rose at a faster pace of 19.27 per cent to $292.38 billion, resulting in a merchandise trade deficit of $118.60 billion, against $96.66 billion a year earlier.
Read also: India’s Exports Surge 13.6% to $80.8 Billion in April 2026; Gold Imports Spike 81.6%
Petroleum, Electronics and Engineering Drive Export Growth
Petroleum products emerged as one of the strongest contributors to July’s export growth. Exports of petroleum products jumped 67.64 per cent to $6.92 billion, from $4.13 billion in July 2025.
Electronic goods exports surged 57.40 per cent to $5.92 billion, compared with $3.76 billion a year earlier, underlining the continued expansion of India’s electronics export ecosystem.
Engineering goods exports increased 17.71 per cent to $12.24 billion, from $10.40 billion, while exports of organic and inorganic chemicals rose 14.39 per cent to $2.80 billion.
Exports of cotton yarn, fabrics, made-ups and handloom products increased 8.40 per cent to $1.11 billion.
Other sectors recording significant export growth in July included iron ore, which rose 78.35 per cent, meat, dairy and poultry products (40.84 per cent), cashew (25.11 per cent), marine products (17.83 per cent), handicrafts excluding handmade carpets (15.55 per cent), plastics and linoleum (11.01 per cent) and drugs and pharmaceuticals (0.74 per cent).
Non-Petroleum Exports Maintain Positive Momentum
Non-petroleum exports stood at $37.32 billion in July 2026, compared with $32.86 billion in July 2025.
Cumulatively, non-petroleum exports during April-July 2026-27 reached $143.61 billion, registering a 12.79 per cent increase over $127.32 billion in the year-ago period.
Non-petroleum and non-gems-and-jewellery exports rose to $35 billion in July, from $30.47 billion a year earlier. During April-July, these exports increased to $134.02 billion, compared with $118.27 billion in the corresponding period last year.
Services Continue to Cushion Overall Trade Balance
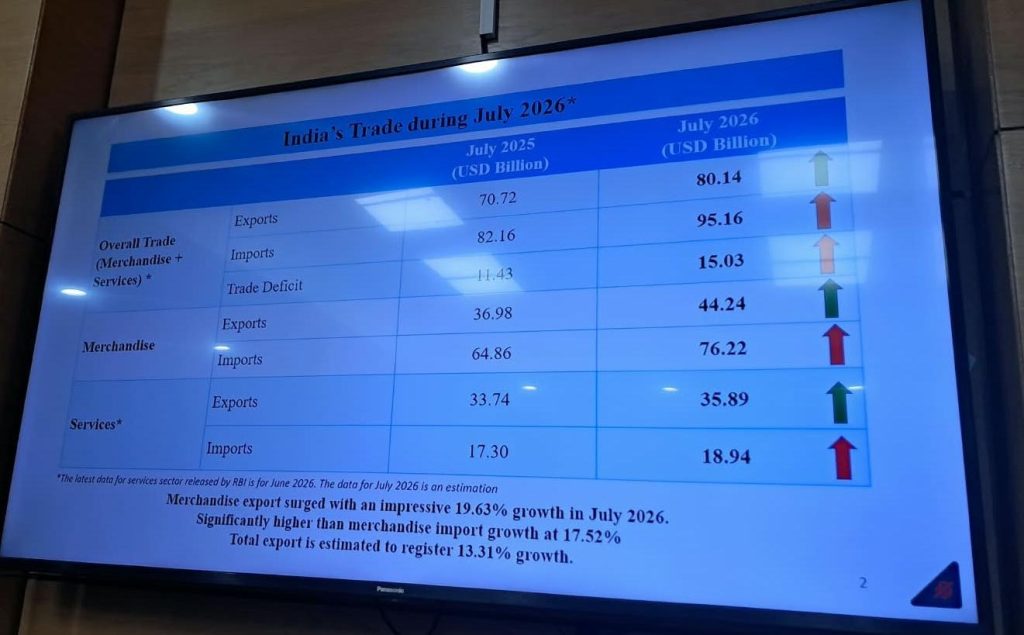
Services exports also remained a key strength for India’s external sector. Estimated services exports rose to $35.89 billion in July 2026, from $33.74 billion in July 2025, while services imports increased to $18.94 billion from $17.30 billion.
During April-July 2026-27, services exports are estimated at $142.64 billion, compared with $131.15 billion a year earlier. Services imports stood at $73.47 billion, up from $66.81 billion.
The services trade surplus consequently increased to $69.17 billion during April-July, compared with $64.35 billion in the corresponding period of 2025-26.
Overall, India’s total exports of merchandise and services in July are estimated at $80.14 billion, up 13.31 per cent from $70.72 billion in July 2025. Total imports rose 15.83 per cent to $95.16 billion, resulting in an overall trade deficit of $15.03 billion, compared with $11.43 billion a year earlier.
US Remains Key Focus Amid Trade Deal Talks
The latest trade data comes amid continued negotiations between India and the United States on a bilateral trade agreement.
Commerce Secretary Rajesh Agrawal said India and the US remain committed to moving ahead with the trade deal, despite a US legislative process concerning sanctions and potential tariffs linked to purchases of Russian oil and gas.
Agrawal said the US legislation was an internal legislative process and declined to comment on its potential implications for India. He said both sides remain engaged through regular contacts and are committed to moving forward with the trade agreement in the agreed spirit.
The US Senate has passed legislation that could provide the US President authority to impose tariffs of up to 100 per cent on major purchasers of Russian oil and gas, although the legislation still requires consideration by the US House of Representatives.
Export Destinations Show Broad-Based Growth
India recorded strong growth in exports to several major markets during July. The top five destinations in terms of increase in export value were the US (12.85 per cent), China (64.57 per cent), Singapore (83.7 per cent), Kenya (151.41 per cent) and Malaysia (73.03 per cent).
During April-July, exports to Singapore increased 97.11 per cent, China 35.97 per cent, Tanzania 131.2 per cent, South Africa 69.75 per cent and Sri Lanka 111.76 per cent.
On the import side, the major sources registering higher growth in July included Russia (83.85 per cent), China (34.42 per cent), Oman (150.36 per cent), Taiwan (111.3 per cent) and the US (18.11 per cent).
The latest figures highlight a strong acceleration in India’s export engine, led by electronics, petroleum products and engineering goods, although the faster pace of import growth continues to put pressure on the merchandise trade balance.
Read also: India’s Road to $200 Billion BRICS Exports: Opportunities, Challenges and Key Sectors